Disclaimer: I'm not an electrical engineer by training so don't blame me if I get any inference wrongly in my post. 😄
Introduction
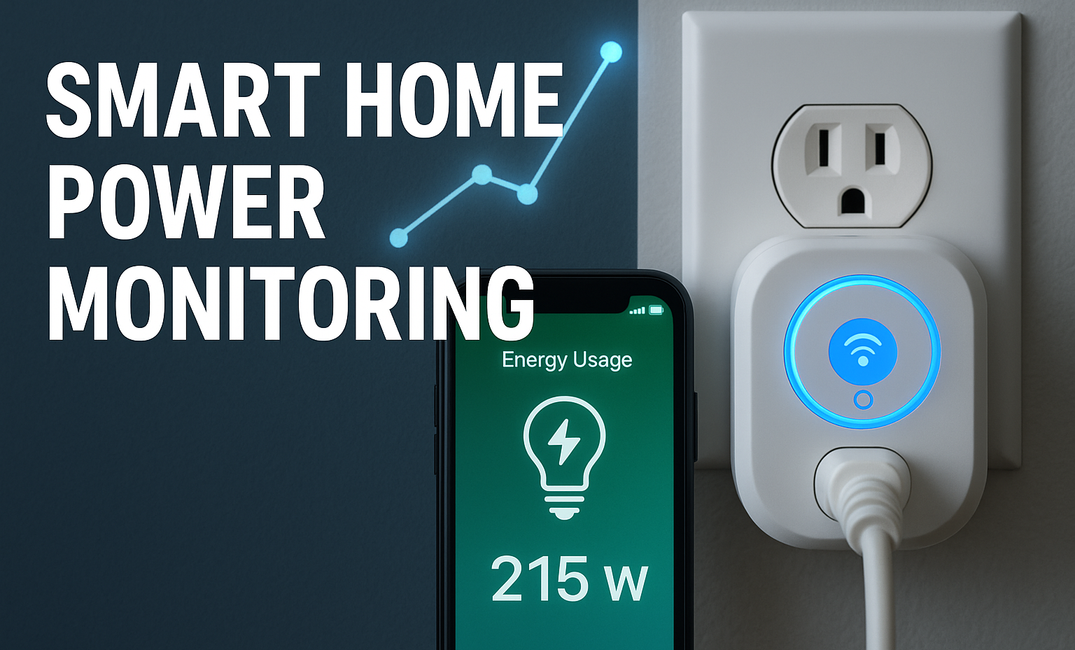
My new house came with this wireless IoT power meter installed in my DB box. I did some research and found several articles talking about this device:
- https://www.straitstimes.com/tech/ampotechs-smart-device-to-track-your-energy-usage
What is AmpoHub
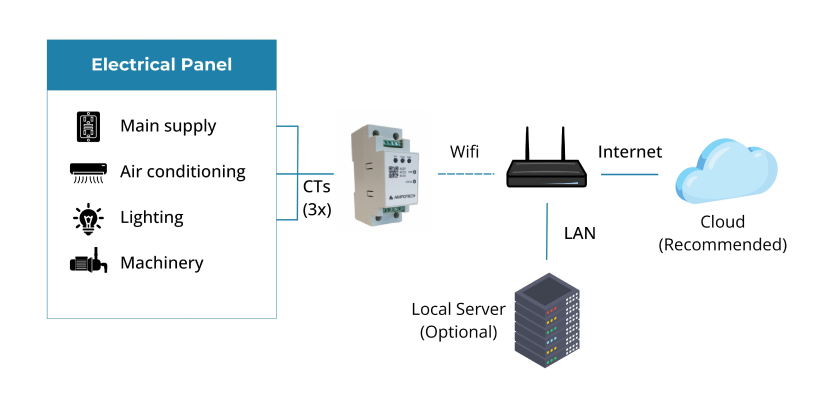
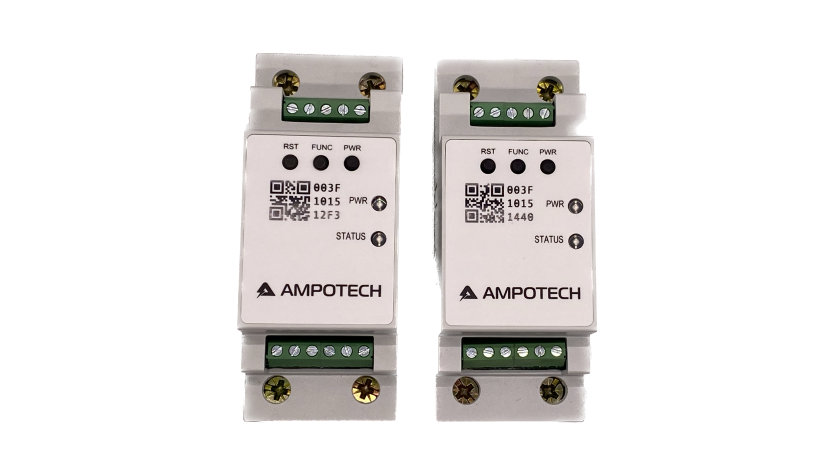
The AmpoHub is a compact, wireless-enabled power meter and IoT gateway. The device is installed in low-voltage electrical distribution panels and has three input channels for current transformer (CT) sensors and three inputs, allowing it to measure single-phrase or three-phrase power. The AmpoHub also has a built-in WiFi module and data logging capability and supports remote device management and troubleshooting through the AmpoCloud platform. With its small size, second-level data rate, and IEC 62053-21 Class 1 accuracy, AmpoHub is suitable for monitoring individual machines, or for metering use cases in residential, commercial, and industrial sites.
What can the AmpoHub monitor?
- Air conditioner
- Freezer
- Cold room
- Pump
- Fan
- Oven
- Air compressor
- Solar inverter
- F&B cooler/heater
- Wall outlet circuit (IT equipment)
- Lighting circuit (Indoor, outdoor)
Use Case
- Application-based uses in solar power monitoring and trip-detection.
- Equipment-specific power monitoring for motors, lighting and airconditioning.
- IoT-enable power monitoring in smart homes and industry 4.0 settings.
Specifications - Measurements
| Number of Channels | 3 Current, 3 Voltage | |
|---|---|---|
| Parameters Measured (Each Channel) | Current (A), Voltage (V) Power (kW), Energy (kWh), Power Factor (dimensionless), Frequency (Hz) | Support Bi-directional energy reading |
| Reporting Rate | Adjustable | |
| Default Reporting Rate | 0.2Hz (report every 5 sec) | |
| Measurement Type | True RMS (8kHz sampling) | |
| Measurement accuracy | Active Power: Class 1 Reactive Power: Class 2 |
Connecting to AmpoHub
I then did some further research and found this http://amposense.com detailing the instructions to connect to the AmpoHub.
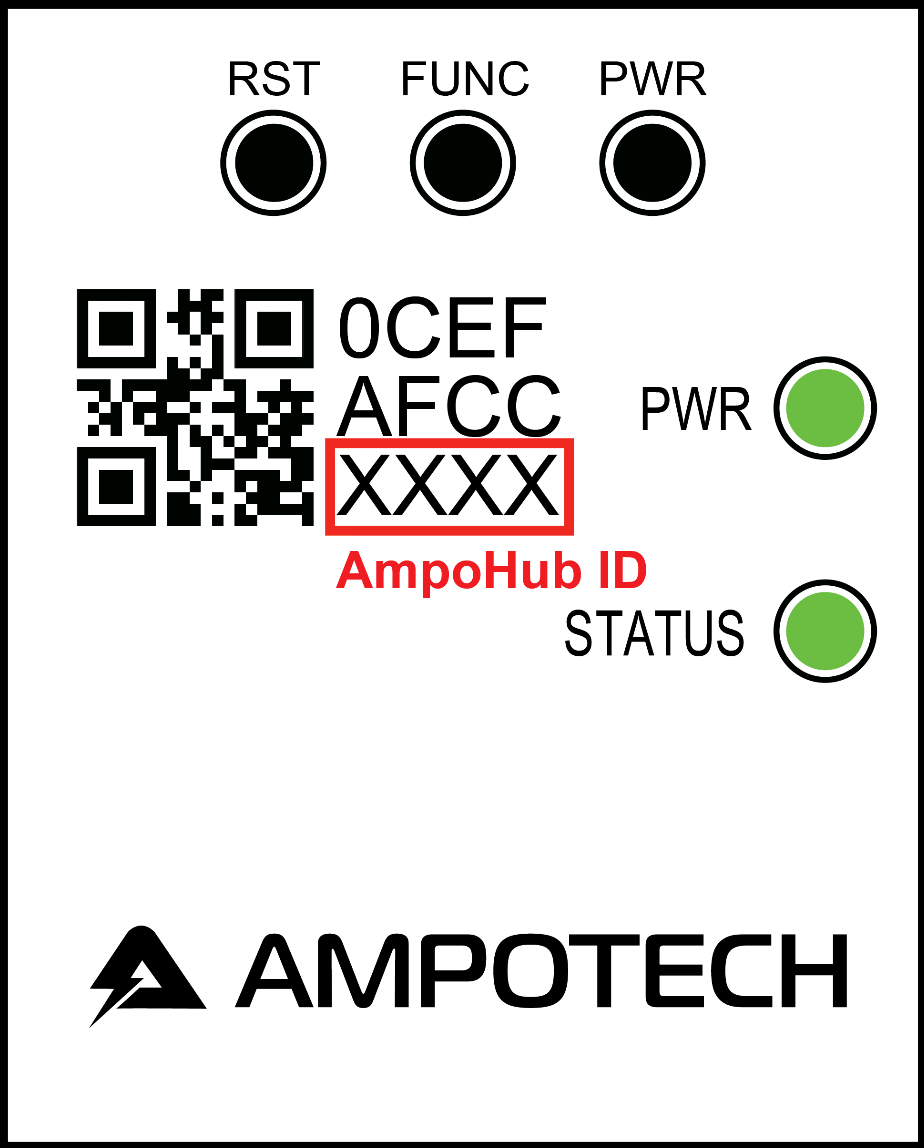
I searched my Wifi networks and found a SSID with AmpoHub-XXXX that correspond to my AmpoHub ID. I then tried to connect to it.
However, no password was given to me during the keys collection. I tried different combination of "password", "admin", etc, until I got the default password of "ampotech". 😄
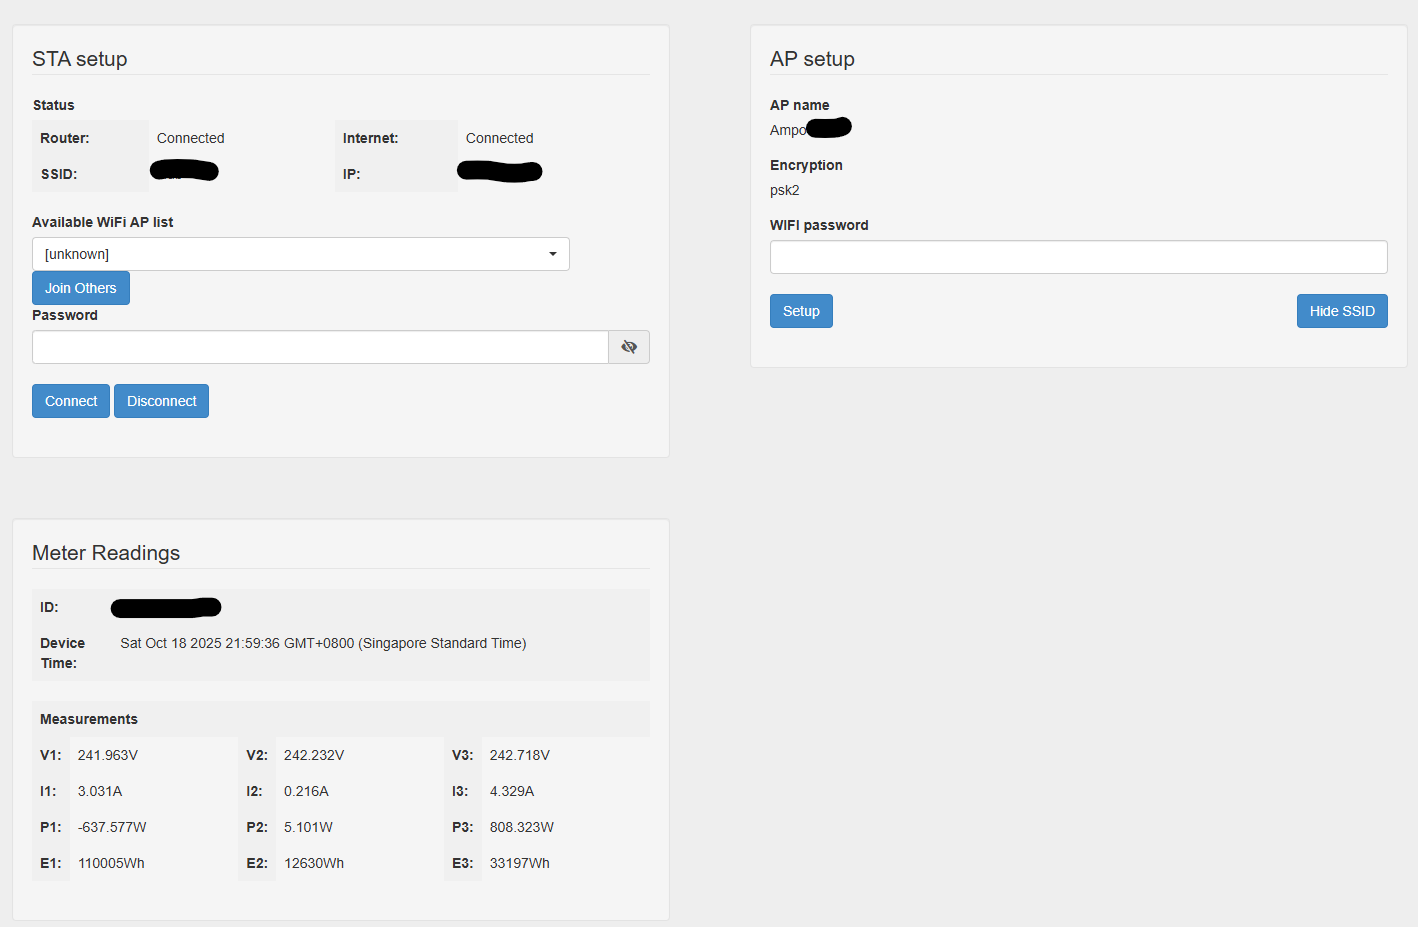
After getting connected, I then visited http://192.168.8.1/ on my browser and successfully see the webui.
Trying to connect to my IoT Wifi network was a nightmare because the webui is designed to loop the get_measurement API call every 2s, resulting in the webpage being very unresponsive.
For the benefit of others, you can set your wifi using curl by executing the following command:
curl http://192.168.8.1/cgi-bin/setwifi?ssid=<your wifi ssid>&password=<your wifi password>Please remember to URL-encode the spaces if any in your SSID name.
Once it's done, you should be able to see your AmpoHub connected to your network and obtained an IP address.
You can now access AmpoHub without connecting to it's own Wifi SSID.
Getting Measurements
I opened up my Chrome Developer Tools and found that the WebUI is calling the following URL (http://<ampohub ip>/cgi-bin/get_measurement) every 2s to obtain the measurements.
To test it out, I tried using curl to obtain the JSON response:
curl -s http://<ampohub ip>/cgi-bin/get_measurementPoint to note: There's a non-standard header being returned in the response by the embedded web server that is causing programatic HTTP requests or Postman to fail. You have to sanitize or ignore the headers in your requests.
To illustrate, we execute the curl with verbose output:
alex@Alex-PC:~$ curl http://<ampohub ip>/cgi-bin/get_measurement -vvvv
*   Trying <ampohub ip>...
* Connected to <ampohub ip> (<ampohub ip>) port 80 (#0)
> GET /cgi-bin/get_measurement HTTP/1.1
> Host: <ampohub ip>
> User-Agent: curl/7.81.0
> Accept: */*
>
* Mark bundle as not supporting multiuse
< HTTP/1.1 200 OK
< Connection: Keep-Alive
< Transfer-Encoding: chunked
< Keep-Alive: timeout=20
< <M2.6&0832&4&480000: 777777:8b7:8b7:00/02/19&23:03:36@242432,242710,243190,2822,216,4298,16,-530624,5170,803963,278510,-775,97,769,156,-3764,4375,2599,2929,110136,12631,33368,110126,4996,0,12552,33283,22907,110136,79,85,87219,302567,-49464,444460,697563,684372,52665,1045330,1782368,1293,81,2019,13236,13251,13282,0,0,0,151,276,30,0,34458,24443,28444,54731,31065,2858,13606,31324,3393,21585,14838,23407,136107,36512,57283,229902>
< Content-Type: application/json
<
{"result":"success", "v1":"242432", "v2":"242710", "v3":"243190", "i1":"2822", "i2":"216", "i3":"4298", "in":"16",
"p1":"-530624", "p2":"5170", "p3":"803963", "pt":"278510", "e1":"110136", "e2":"12631", "e3":"33368", "et":"110126", "freq":"4996", "mcu_time":"xxxx00/02/19&23:03:36"}
* Connection #0 to host <ampohub ip> left intact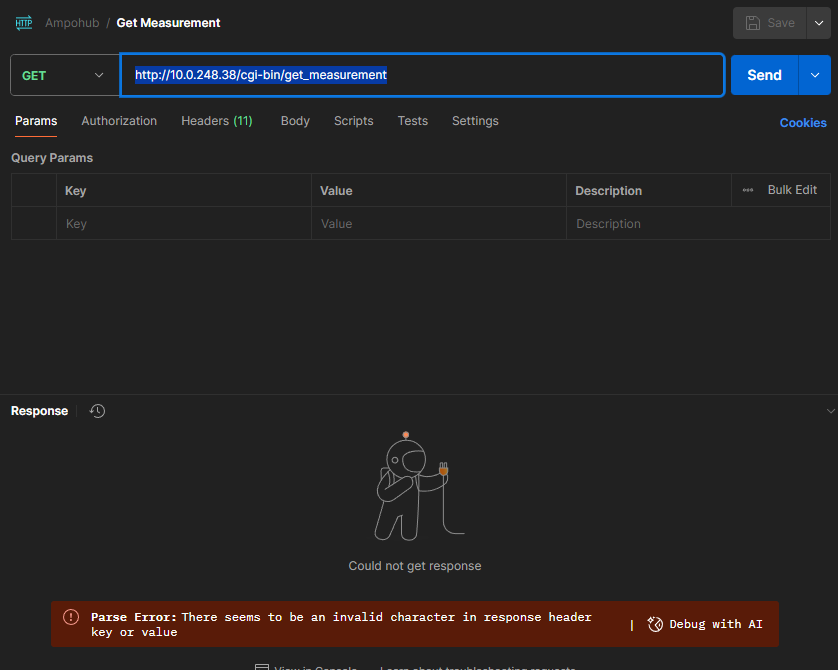
The JSON response will look like this:
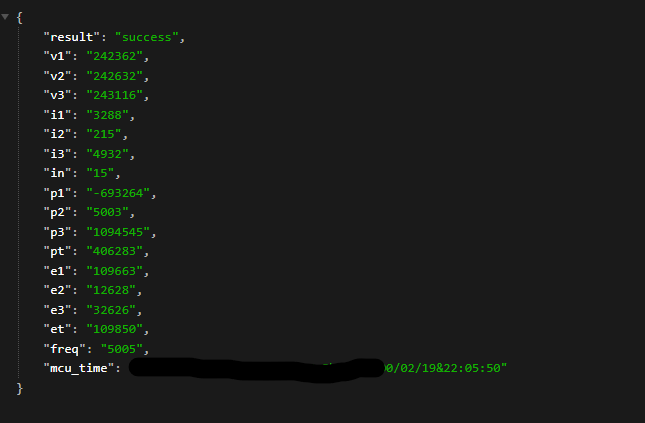
With the response above, I inferred that the field mapping will be as follows:
| Field | Mapping |
|---|---|
| v1 | Voltage Channel 1 (V) |
| v2 | Voltage Channel 2 (V) |
| v3 | Voltage Channel 3 (V) |
| i1 | Current Channel 1 (A) |
| i2 | Current Channel 2 (A) |
| i3 | Current Channel 3 (A) |
| in | Neutral Current (A) |
| p1 | Power Channel 1 (W) |
| p2 | Power Channel 2 (W) |
| p3 | Power Channel 3 (W) |
| pt | Total Active Power (W) |
| e1 | Energy Channel 1 (Wh) |
| e2 | Energy Channel 2 (Wh) |
| e3 | Energy Channel 3 (Wh) |
| et | Total Energy (Wh) |
| freq | Line Frequency (Hz) |
| mcu_time | Firmware/Version & Timestamp |
Creating Sensors in Home Assistant
With the above information, I proceed to create the sensors in Home Assistant. I chose command_line sensor instead of RESTful sensor because of the header issue I mentioned above. Maybe I will fix the header in future, but for now, I prefer to have a working monitoring in place first.
Add the following lines in your configuration.yaml:
command_line:
  - sensor:
      name: AmpoHub IoT Gateway
      command: 'curl -s http://10.0.248.38/cgi-bin/get_measurement'   # AmpoHub API URL
      scan_interval: 5        # seconds
      command_timeout: 5      # seconds
      value_template: "{{ value_json.result }}"
      json_attributes:
        - v1
        - v2
        - v3
        - i1
        - i2
        - i3
        - in
        - p1
        - p2
        - p3
        - pt
        - e1
        - e2
        - e3
        - et
        - freq
        - mcu_time
After which, we have to expose the sensors in the Templates. Add the following lines in your configuration.yaml again.
template:
  - sensor:
      # ---------- Voltages ----------
      - name: "Phase L1 Voltage"
        device_class: voltage
        state_class: measurement
        unit_of_measurement: "V"
        state: "{{ (state_attr('sensor.ampohub_iot_gateway','v1')|float(0) / 1000) | round(1) }}"
      - name: "Phase L2 Voltage"
        device_class: voltage
        state_class: measurement
        unit_of_measurement: "V"
        state: "{{ (state_attr('sensor.ampohub_iot_gateway','v2')|float(0) / 1000) | round(1) }}"
      - name: "Phase L3 Voltage"
        device_class: voltage
        state_class: measurement
        unit_of_measurement: "V"
        state: "{{ (state_attr('sensor.ampohub_iot_gateway','v3')|float(0) / 1000) | round(1) }}"

      # ---------- Currents ----------
      - name: "Phase L1 Current"
        device_class: current
        state_class: measurement
        unit_of_measurement: "A"
        state: "{{ (state_attr('sensor.ampohub_iot_gateway','i1')|float(0) / 1000) | round(3) }}"
      - name: "Phase L2 Current"
        device_class: current
        state_class: measurement
        unit_of_measurement: "A"
        state: "{{ (state_attr('sensor.ampohub_iot_gateway','i2')|float(0) / 1000) | round(3) }}"
      - name: "Phase L3 Current"
        device_class: current
        state_class: measurement
        unit_of_measurement: "A"
        state: "{{ (state_attr('sensor.ampohub_iot_gateway','i3')|float(0) / 1000) | round(3) }}"

      # ---------- Frequency ----------
      - name: "Mains Frequency"
        device_class: frequency
        state_class: measurement
        unit_of_measurement: "Hz"
        state: "{{ (state_attr('sensor.ampohub_iot_gateway','freq')|float(0) / 100) | round(2) }}"

      # ---------- Active Power (per phase & total) ----------
      - name: "L1 Active Power"
        device_class: power
        state_class: measurement
        unit_of_measurement: "W"
        state: "{{ ((state_attr('sensor.ampohub_iot_gateway','p1')|float(0) / 1000) | abs) | round(0) }}"
      - name: "L2 Active Power"
        device_class: power
        state_class: measurement
        unit_of_measurement: "W"
        state: "{{ ((state_attr('sensor.ampohub_iot_gateway','p2')|float(0) / 1000) | abs) | round(0) }}"
      - name: "L3 Active Power"
        device_class: power
        state_class: measurement
        unit_of_measurement: "W"
        state: "{{ ((state_attr('sensor.ampohub_iot_gateway','p3')|float(0) / 1000) | abs) | round(0) }}"
      - name: "Total Active Power"
        device_class: power
        state_class: measurement
        unit_of_measurement: "W"
        state: "{{ ((state_attr('sensor.ampohub_iot_gateway','pt')|float(0) / 1000) | abs) | round(0) }}"

      # ---------- Neutral Current (A) ----------
      - name: "Neutral Current"
        device_class: current
        state_class: measurement
        unit_of_measurement: "A"
        state: "{{ (state_attr('sensor.ampohub_iot_gateway','in')|float(0)) }}"

      # Split signed power into import/export (Energy Dashboard likes separate flows)
      - name: "Grid Power Import"
        device_class: power
        state_class: measurement
        unit_of_measurement: "W"
        # If your device uses negative for import, flip sign here:
        state: >-
          {% set p = (state_attr('sensor.ampohub_iot_gateway','pt')|float(0) / 1000) %}
          {{ (0 - p) if p < 0 else 0 }}
      - name: "Grid Power Export"
        device_class: power
        state_class: measurement
        unit_of_measurement: "W"
        state: >-
          {% set p = (state_attr('sensor.ampohub_iot_gateway','pt')|float(0) / 1000) %}
          {{ p if p > 0 else 0 }}

      # ---------- Energy (cumulative) ----------
      # If et is Wh, convert to kWh and mark as total_increasing for Energy Dashboard
      - name: "Total Energy"
        device_class: energy
        state_class: total_increasing
        unit_of_measurement: "kWh"
        state: "{{ ((state_attr('sensor.ampohub_iot_gateway','et')|float(0) / 1000) | abs) | round(3) }}"
To have historical graphs available in my dashboard, I created the following Utility_meter sensors as well:
utility_meter:
  grid_daily:
    source: sensor.total_energy
    cycle: daily
    delta_values: true
  grid_monthly:
    source: sensor.total_energy
    cycle: monthly
    delta_values: true
Restart your Home Assistant to take effect.
Creating dashboard in Home Assistant to show AmpoHub data
Create a new dashboard and go to the RAW editor. Paste the following into the editor:
views:
  - title: AmpoHub
    sections:
      - type: grid
        cards:
          - type: heading
            heading: Raw Data
            heading_style: title
          - type: entities
            entities:
              - sensor.ampohub_iot_gateway
            title: Status
            state_color: false
          - graph: line
            type: sensor
            entity: sensor.mains_frequency
            detail: 2
            grid_options:
              columns: full
          - type: entities
            entities:
              - entity: sensor.phase_l1_voltage
              - entity: sensor.phase_l1_current
              - entity: sensor.l1_active_power
          - type: entities
            entities:
              - entity: sensor.phase_l2_voltage
              - entity: sensor.phase_l2_current
              - entity: sensor.l2_active_power
          - type: entities
            entities:
              - entity: sensor.phase_l3_voltage
              - entity: sensor.phase_l3_current
              - entity: sensor.l3_active_power
          - type: tile
            entity: sensor.neutral_current
            vertical: false
            features_position: bottom
            grid_options:
              columns: full
          - type: entities
            entities:
              - entity: sensor.total_active_power
              - entity: sensor.total_energy
      - type: grid
        cards:
          - type: heading
            heading: Graphs
            heading_style: title
          - type: history-graph
            entities:
              - entity: sensor.grid_daily
            title: Daily Power Usage
            hours_to_show: 24
            logarithmic_scale: false
            grid_options:
              columns: full
          - type: history-graph
            entities:
              - entity: sensor.grid_monthly
            title: Monthly Power Usage
            grid_options:
              columns: full
            hours_to_show: 720
        column_span: 2
      - type: grid
        cards:
          - type: heading
            heading: Current Usage Summary
            heading_style: title
          - type: gauge
            entity: sensor.total_active_power
            needle: false
          - type: gauge
            entity: sensor.total_energy
    type: sections
    max_columns: 4
    cards: []
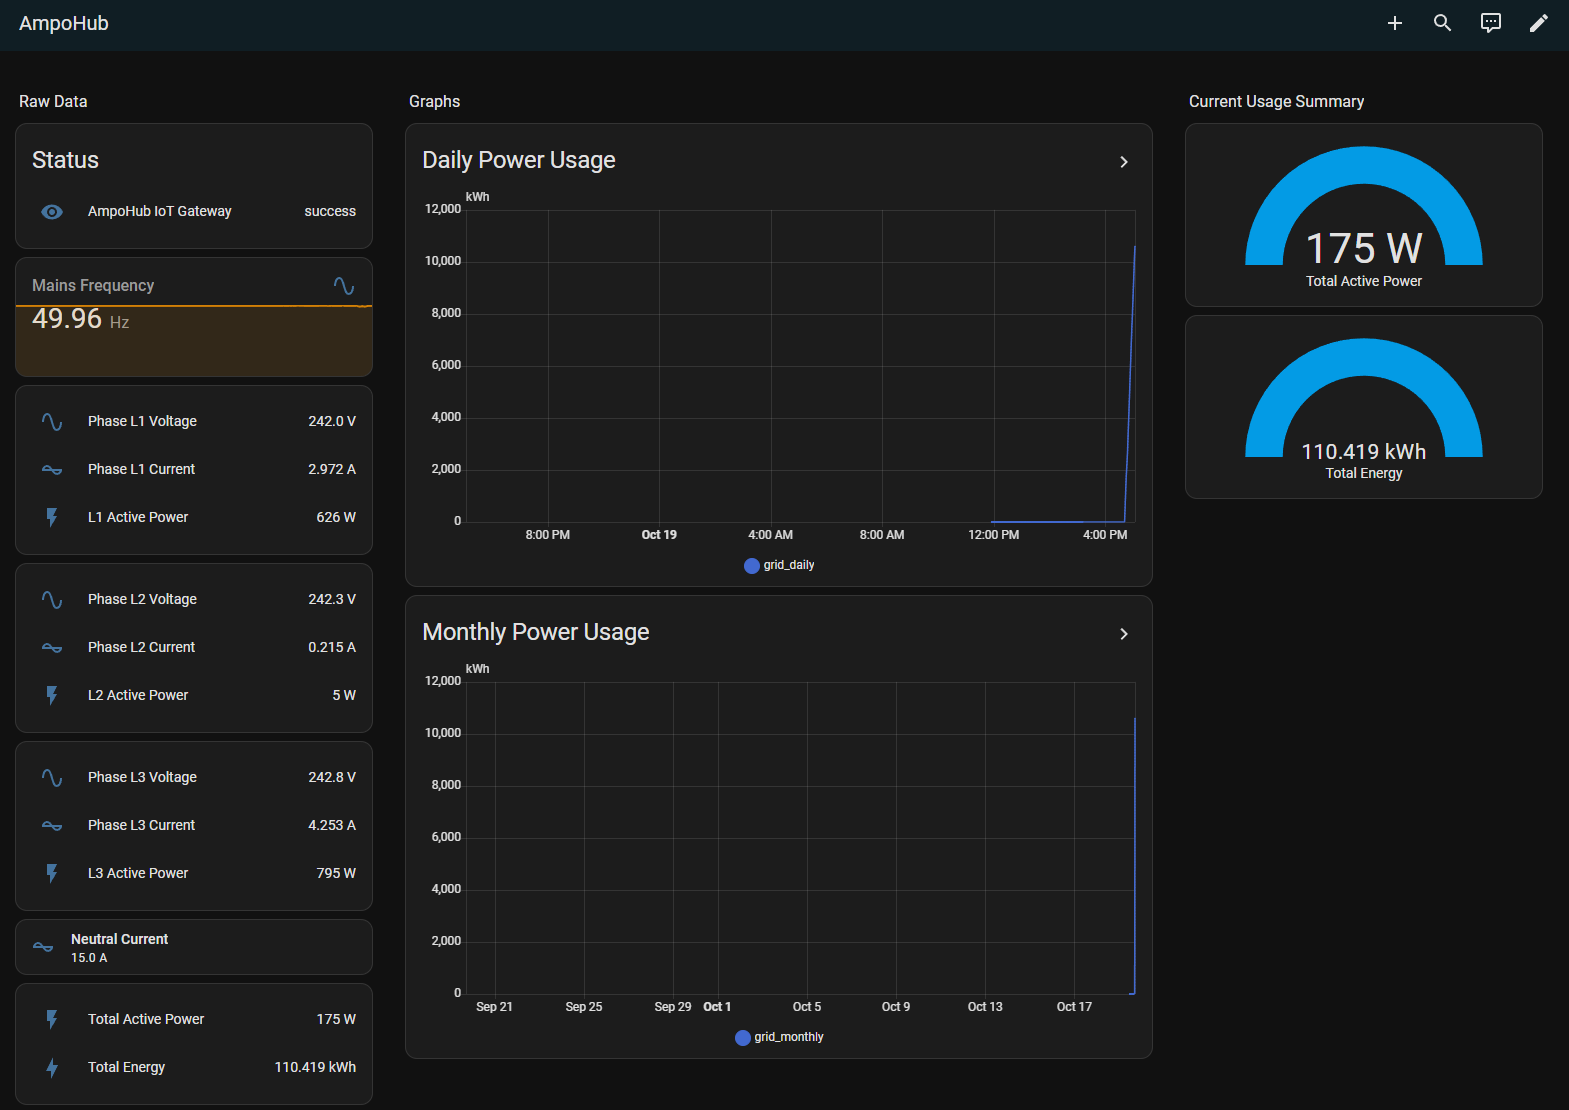
Once that is done, you should be able to see a dashboard similar to this:
Github Repository
To view the files mentioned in my post, visit my GitHub Repository at https://github.com/alexlogy/homeassistant-ampohub.