Introduction: Why Build a SIEM in a Home Lab
Throughout my life, I have always been drawn to building proof-of-concepts (POCs), not just to validate ideas, but also to understand how it behave under real-world conditions. Having a home lab at home gives me the freedom to do this without the cost constraints of the cloud while retaining full control over the environment.
In today's cloud-native landscape, it's easy for us to forget how much complexity is abstracted away from us. Spinning up a Kubernetes cluster on AWS/Azure/GCP, provisioning a database via platforms like Supabase, has become almost trival. While these convenience accelerates delivery, it also create a gap where we lose touch with the underlying mechanics that run these systems.
This gap is especially apparent in controlled environments, such as government or financial institutions, where cloud integrations are restricted due to regulations, engineers are expected to understand the full stack from infrastructure to security in detail.
A homelab helps to bridge this gap as it forces you to think beyond deployment and into areas that are often overlooked, particularly observability and security. It's important to know how to operate systems, it's also important to understand what these systems are doing, the architecture, etc. This will allow us to understand their potential attack surface, and how to detect when something goes wrong.
The gap between Home Lab and real-world security
Most home labs focus heavily on infrastructure, spinning up virtualization clusters, kubernetes clusters, network equipment, etc. However, many people often overlook security visibility. Infrastructure that were provisioned were left forgotten and unmanaged, creating vulnerabilities when new CVEs are found.
In the real-world environments, especially at enterprise scale, telemetry is important as it generate the visibility into the instructure. Every system, endpoints, network flows generate telemetry and they are fed into a centralised monitoring platform such as Splunk, Datadog, etc. This is how organisations detect breaches, investigate incidents and maintain operational governance.
In contrast, a typical home lab has:
- No centralised logging
- No correlation of events and interactions across systems
- No structured way to detect suspicious behavior
Building a SIEM in your home lab closes this gap as it shifts your mindset from simply running systems to observing, analysing, and defending them, which is closer to the real-world environments.
What is SIEM and XDR?
SIEM stands for "Security Information and Event Management". A SIEM platform will strengthen your cybersecurity posture by giving full real-time visibility across your infrastructure.
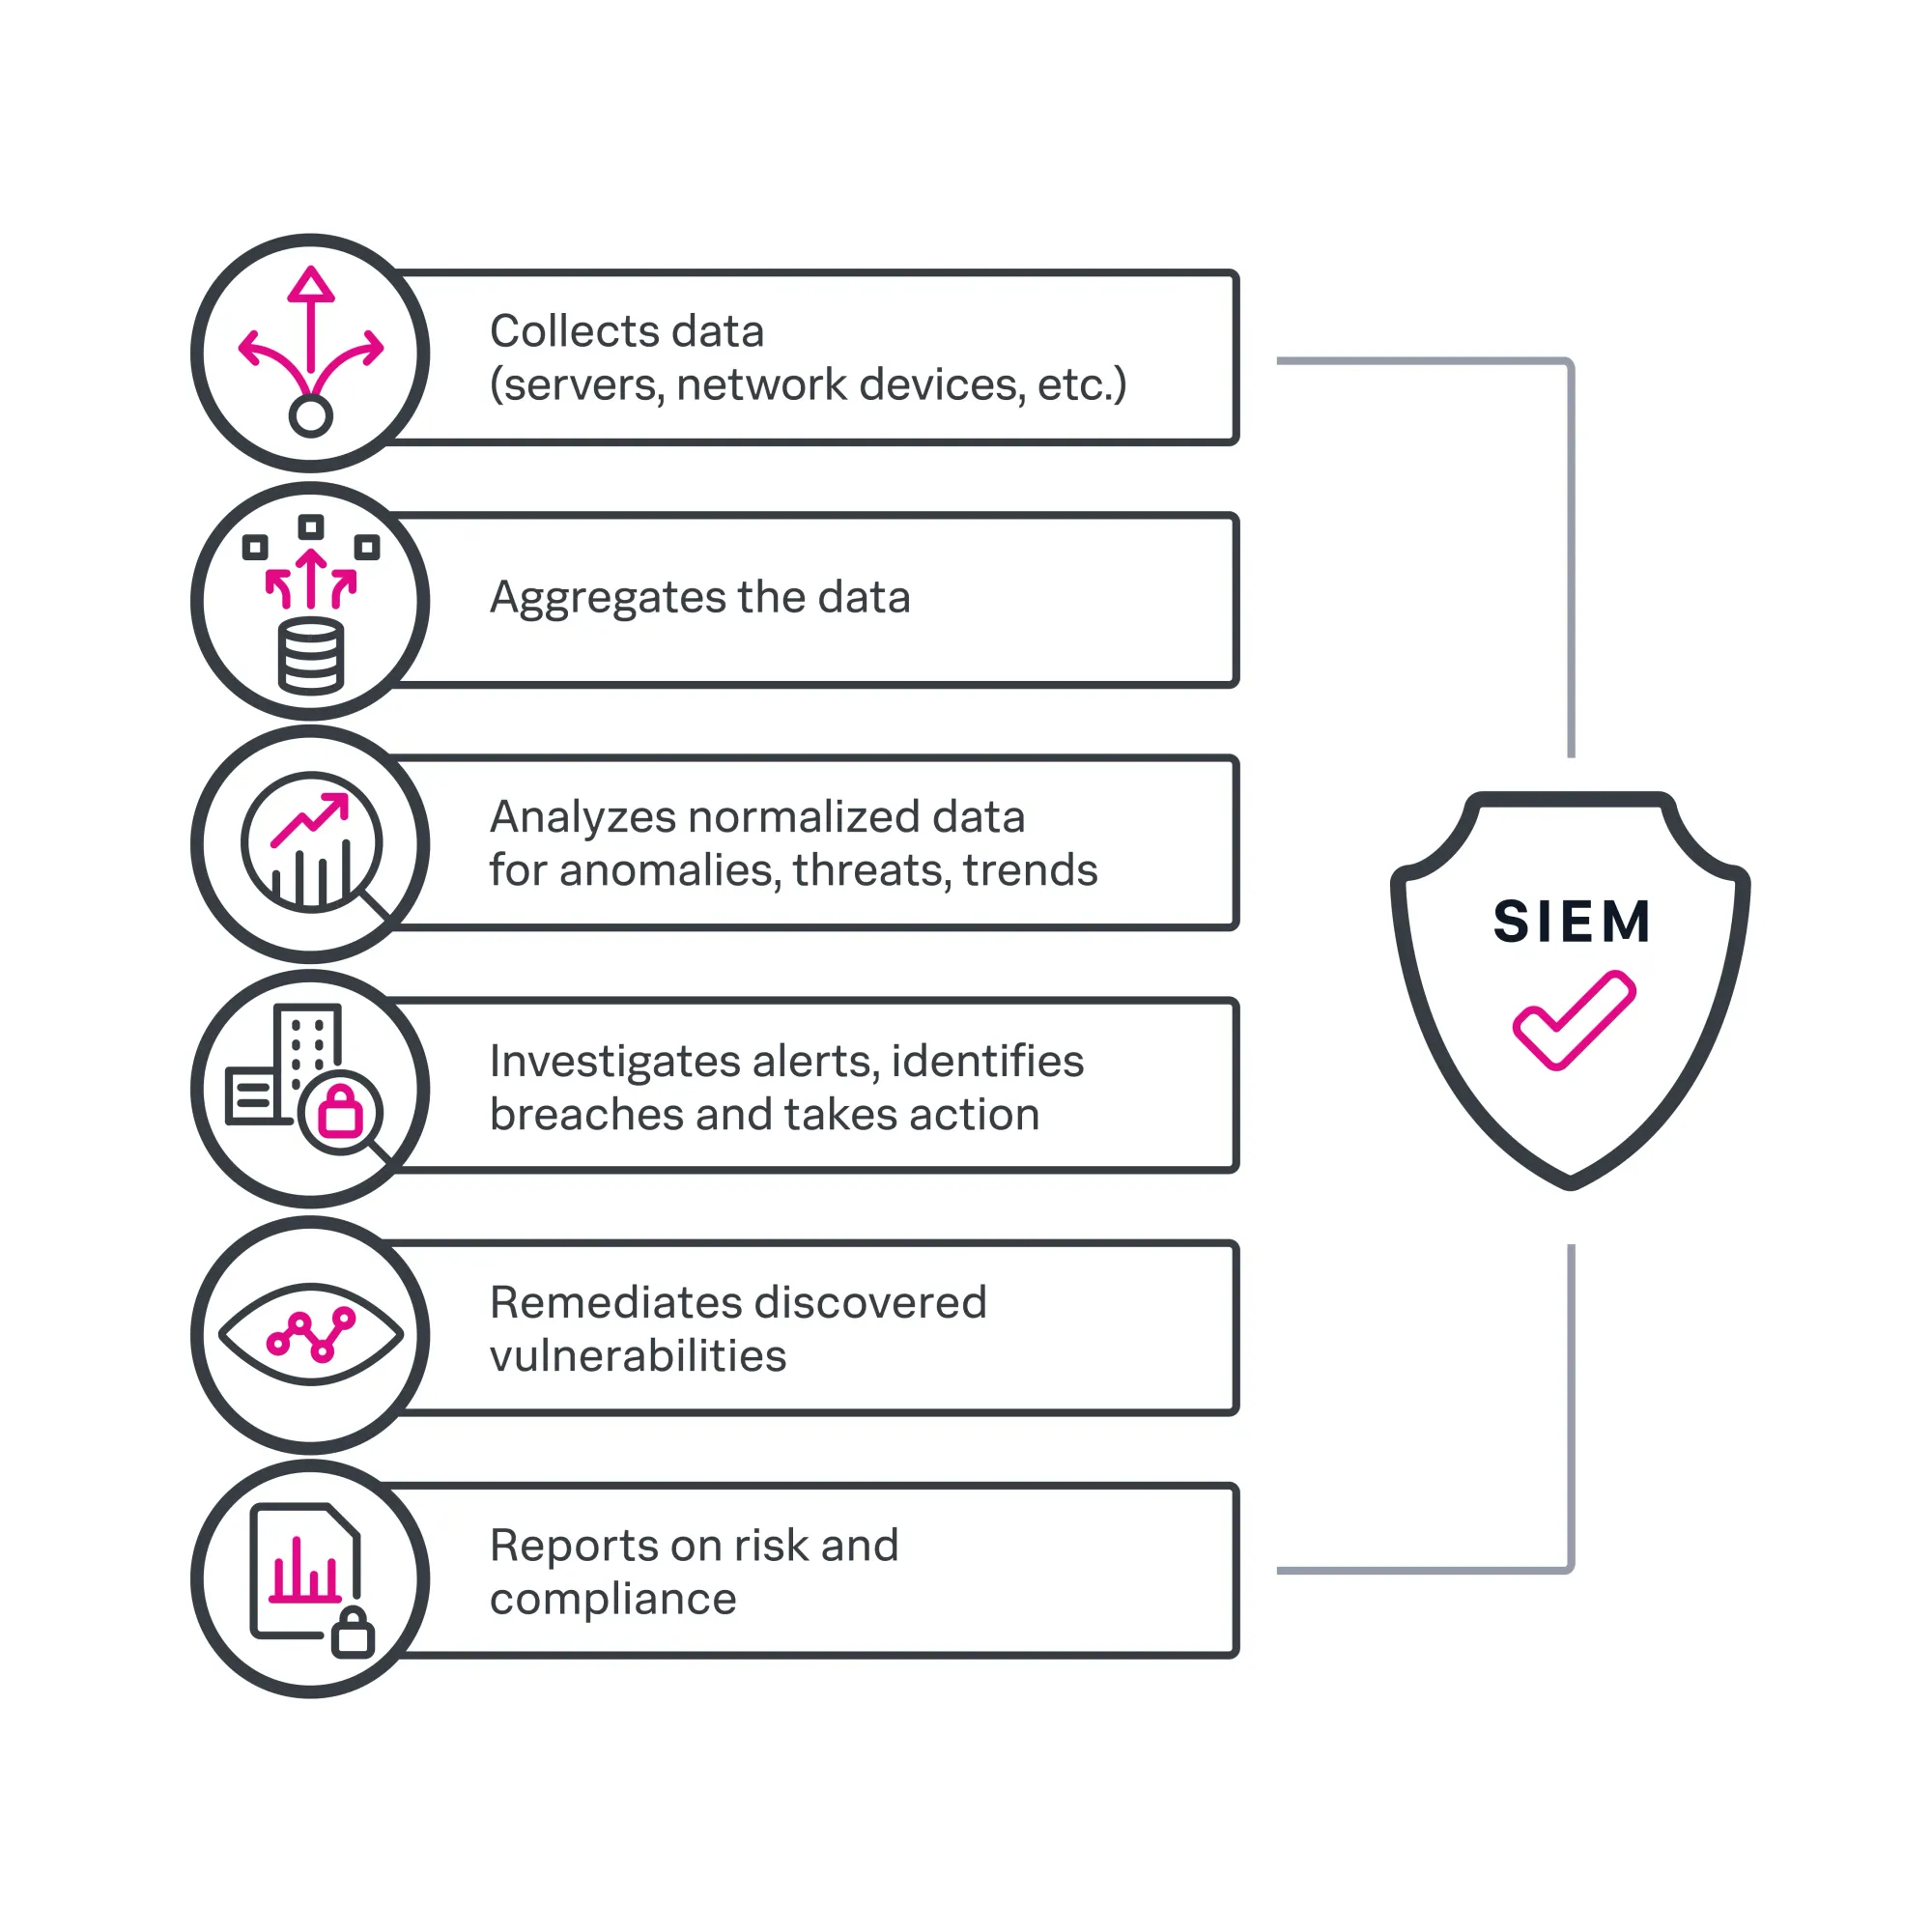
SIEM platform:
- Collect logs from multiple sources (servers, workstations, network devices, applications, etc) in real-time
- Normalize and indexes the data
- Apply rules to detect suspicious pattern aka abnormalities
- Generate alerts for further investigation
XDR stands for "Extended Detection and Response". It's a unified security solution that allow security teams to rapidly and efficiently hunt and eliminate security threats across multiple domains.
XDR platform:
- Extending visibility across endpoints, systems and sometimes network layers
- Correlating events across different data sources
- Providing more information and context for detection and response
When implemented properly, these systems allow you to detect intrusion attempts in real-time, identify unusual process execution, trace attack paths aka lateral movements across multiple systems. This is the foundation of a modern Security Operations Center (SOC).
Why Wazuh is a strong choice?
There are many commercial solutions for SIEM and XDR out there, such as Splunk, Microsoft Sentinel, CrowdStrike Falcon XDR, SentinelOne Singularity XDR, etc. These are expensive solutions that might not fit organisations with smaller budget.
Wazuh is a free and open-source security platform that unifies XDR and SIEM capabilities. It protects workloads across on-premises, virtualized, containerized and cloud-based environments. It mirrors many concepts used in enterprise environments such as logging pipelines, detection rules, alerting workflows, without requiring the cost and complexity of commercial platforms.
It provides:
- Agent-based monitoring for endpoints (Linux, Windows, macOS)
- Log collection and analysis across your environment
- File Integrity Monitoring (FIM) to detect unauthorized changes
- Threat detection rules mapped to framworks like MITRE ATT&CK
- Built-in visualization
This make it an ideal platform not just for experimentation and also for building practical, real-world security engineering skills in a controlled environment.
Architecture Overview
If you're familiar with the ELK stack, you will find it very similar to the ingestion pipeline, storage and visualization.
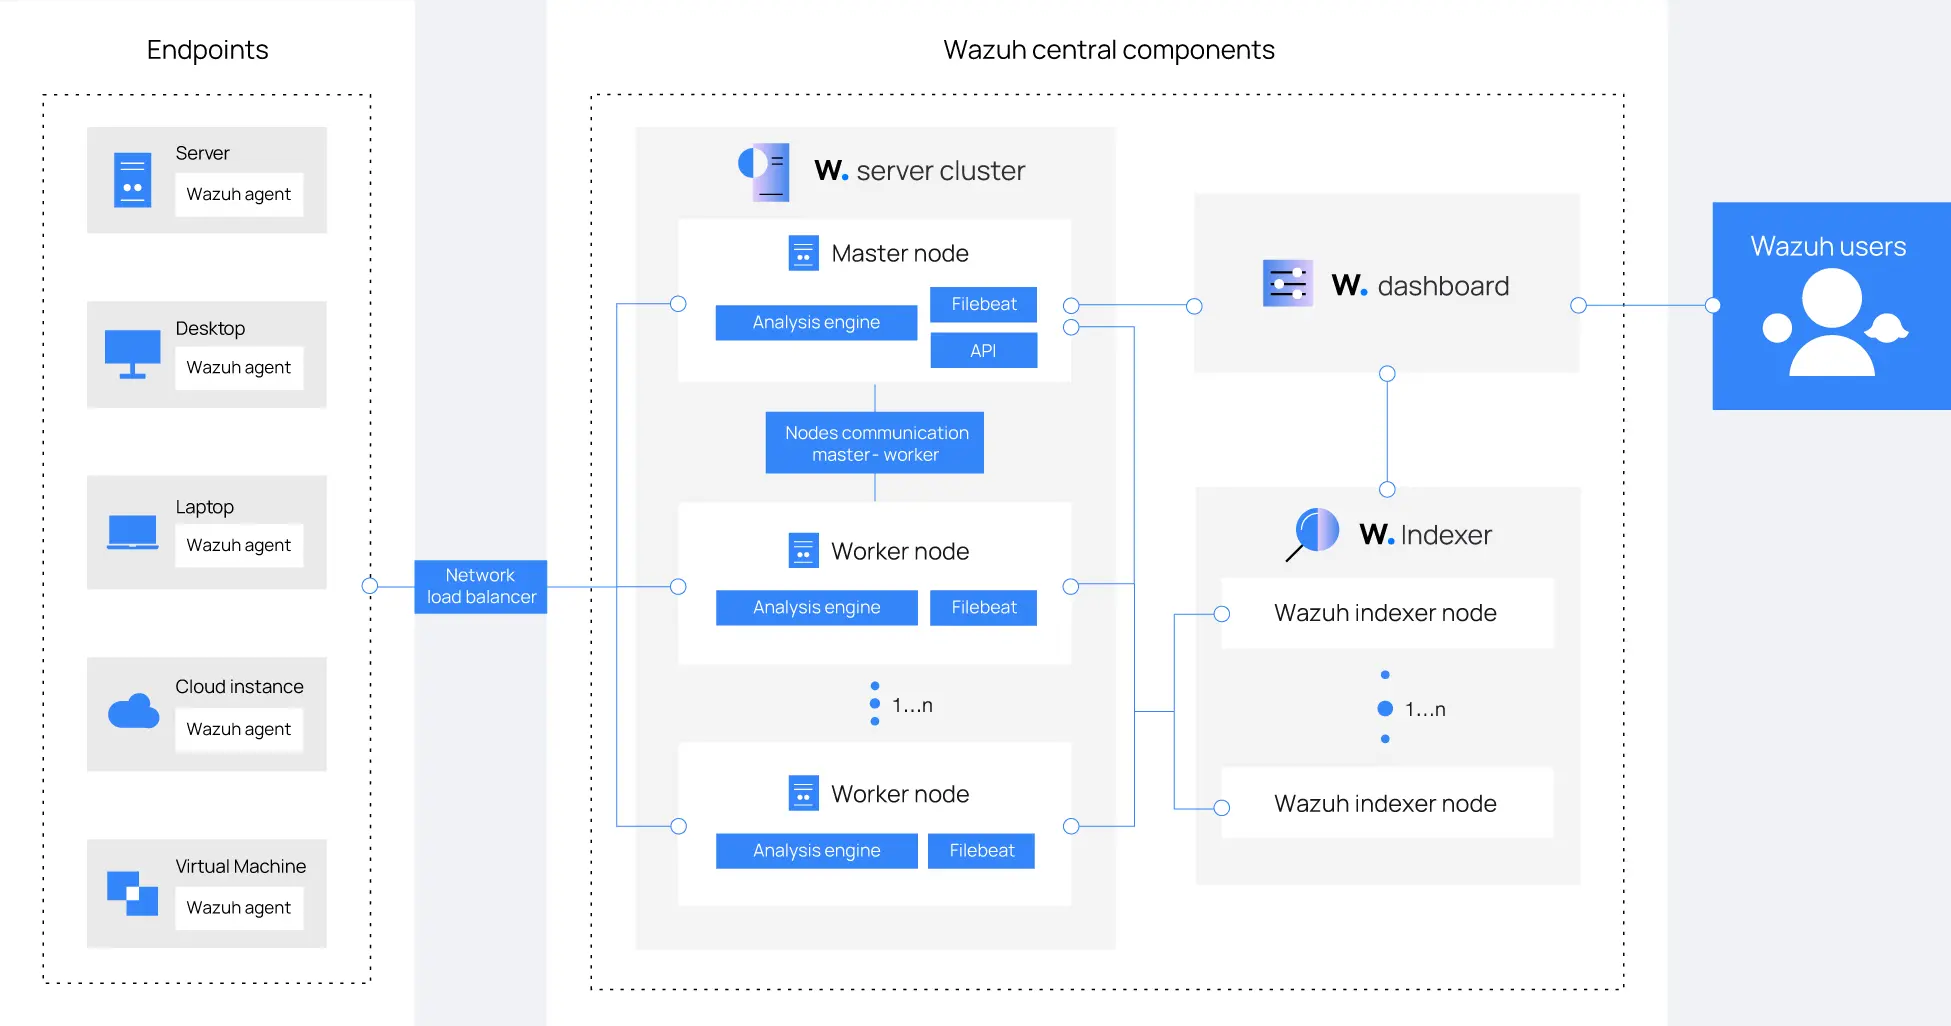
The Wazuh architecture is composed of four main components:
- Wazuh Agent
- The Wazuh agent is installed on endpoints and is responsible for collection logs, monitoring file integrity, detecting suspicious local activity and sending telemetry back to the Wazuh Server. This is essential the eyes and ears for Wazuh.
- Wazuh Indexer
- The Wazuh indexer is a highly scalable, full-text search and analytics engine based on OpenSearch. It's responsible for storing and indexing logs, enabling fast search and querying of logs while supporting analytics and historical investigation.
- Wazuh Server
- The Wazuh server is the central component responsible for analyzing data collected from Wazuh agents. It detect threats, anomalies, and regulatory compliance violations in real-time, generating alerts when suspicious activity is identified. This is effectively the brain of Wazuh where raw data is transformed into actionable insights.
- Wazuh Dashboard
- The Wazuh dashboard is a web interface for visualizing, analyzing, and manging security data. This is where detection becomes visible and actionable.
A full overview of the architecture diagram for Wazuh setup can be seen below in the documentations:
The data flow from endpoint to detection follows:
- Events are generated on endpoints (Eg. Login attempts, process execution)
- Wazuh agent collect and forward the logs to Wazuh Manager
- Wazuh manager analyze the data using predefined rules
- Wazuh indexer store the processed data
- Wazuh dashboard visualize the alerts and security insights
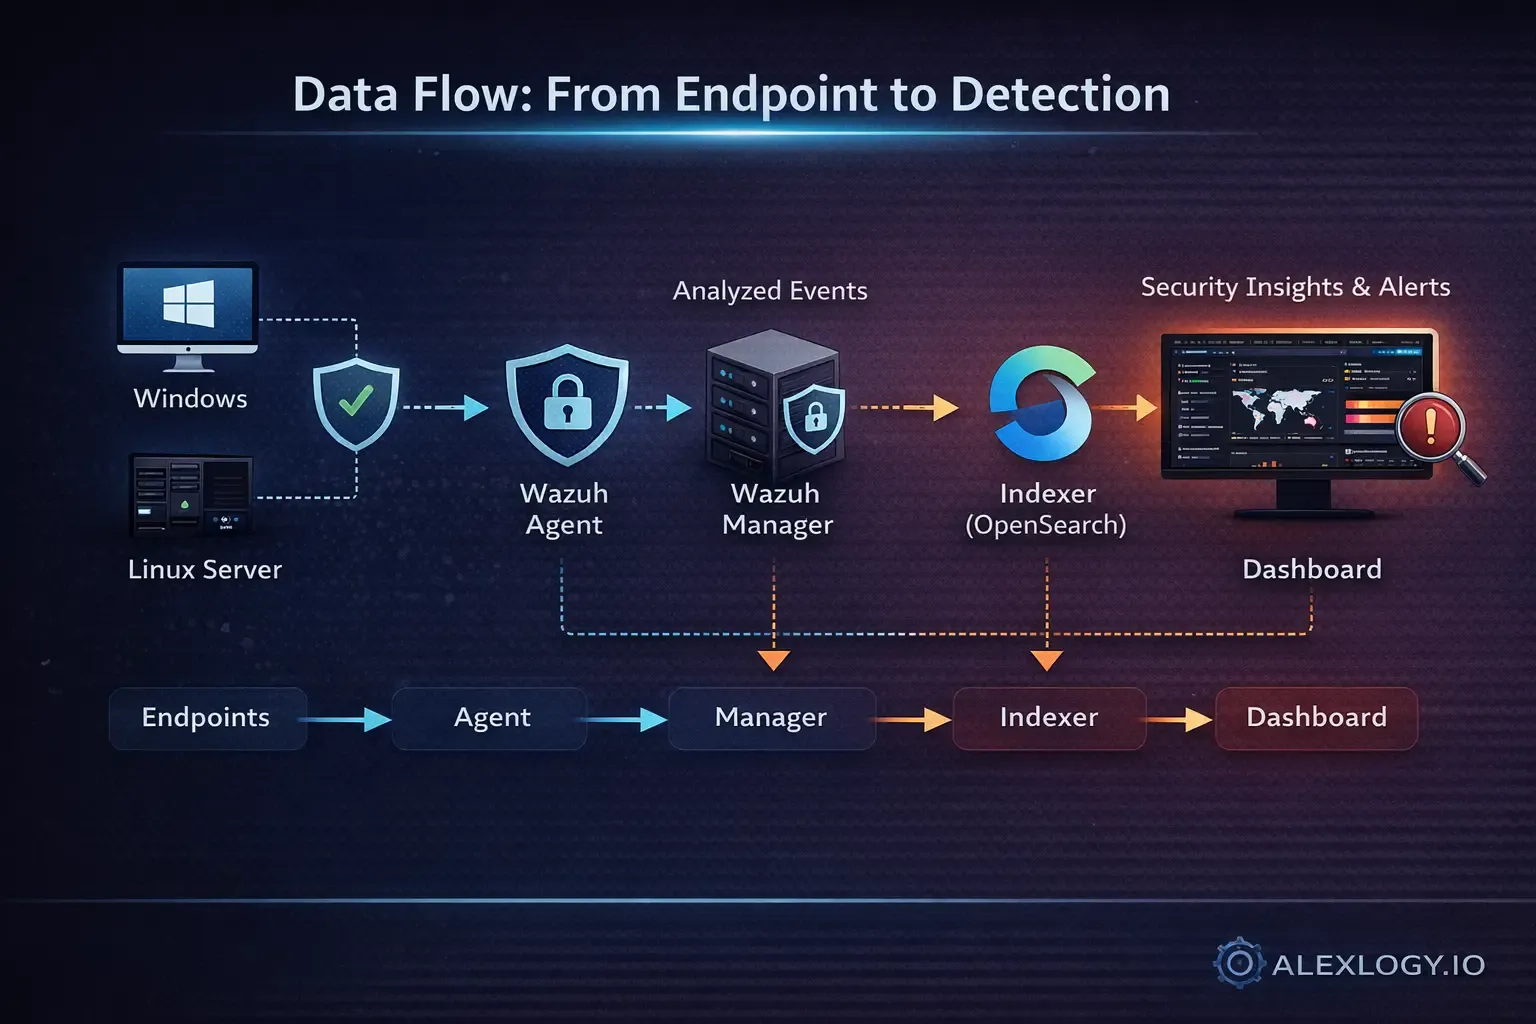
This pipeline is the foundation of any SIEM system.
Pre-requisites for Home Lab Setup
Reference: https://documentation.wazuh.com/current/getting-started/index.html
For a single-node installation, the minimum requirements for the node will be:
- CPU: 2 vCPU cores
- RAM: 4GB
- Storage: 50GB
- OS: x64 Linux (I'm using Ubuntu Server 24.04 LTS)
Since the Wazuh agent will be communicating with the Wazuh Server, it's recommended to have static IP addresses available for the Wazuh core components.
Installing Wazuh
Since I'm installing Wazuh in my Home Lab environment with limited resources and limited endpoints, I chose to install on a single-node.
Initial Configuration
Download the configuration file.
curl -sO https://packages.wazuh.com/4.14/config.ymlEdit config.yml and replace the node names and IP values with the corresponding names and IP addresses in your setup. I'm going to leave the node names as default for now.
nodes:
  # Wazuh indexer nodes
  indexer:
    - name: node-1
      ip: "10.0.0.10"
    #- name: node-2
    #  ip: "<indexer-node-ip>"
    #- name: node-3
    #  ip: "<indexer-node-ip>"

  # Wazuh server nodes
  # If there is more than one Wazuh server
  # node, each one must have a node_type
  server:
    - name: wazuh-1
      ip: "10.0.0.10"
    #  node_type: master
    #- name: wazuh-2
    #  ip: "<wazuh-manager-ip>"
    #  node_type: worker
    #- name: wazuh-3
    #  ip: "<wazuh-manager-ip>"
    #  node_type: worker

  # Wazuh dashboard nodes
  dashboard:
    - name: dashboard
      ip: "10.0.0.10"
Download the Wazuh installation assistant. As of this post, the latest version is 4.14.
curl -sO https://packages.wazuh.com/4.14/wazuh-install.shRun the Wazuh installation assistant with the option --generate-config-files to generate the Wazuh cluster key, certificates, and passwords necessary for installation.
chmod +x wazuh-install.sh
./wazuh-install.sh --generate-config-files
Installing Wazuh Indexer
Run the Wazuh installation assistant with the option --wazuh-indexer followed by the node name.
Note: The node name must be the same one used in config.yml for the initial configuration.
./wazuh-install.sh --wazuh-indexer node-1Cluster Initialization
Once your indexer is installed, we will need to run the security admin script to load the new certificates information and start the cluster.
./wazuh-install.sh --start-clusterNote: You only have to initialize the cluster once, there is no need to run this command on every node.
Test the cluster installation
We will need to verify the Wazuh indexer is installed correctly and the cluster is functioning as expected with the following commands:
tar -axf wazuh-install-files.tar wazuh-install-files/wazuh-passwords.txt -O | grep -P "\'admin\'" -A 1Run the following command to confirm the installation is successful.
curl -k -u admin https://<WAZUH_INDEXER_IP_ADDRESS>:9200You should be prompted a password which you obtained earlier. Then, you should get an output similar to this:
{
  "name" : "node-1",
  "cluster_name" : "wazuh-indexer-cluster",
  "cluster_uuid" : "095jEW-oRJSFKLz5wmo5PA",
  "version" : {
    "number" : "7.10.2",
    "build_type" : "deb",
    "build_hash" : "db90a415ff2fd428b4f7b3f800a51dc229287cb4",
    "build_date" : "2026-03-13T10:29:35.190091416Z",
    "build_snapshot" : false,
    "lucene_version" : "9.12.3",
    "minimum_wire_compatibility_version" : "7.10.0",
    "minimum_index_compatibility_version" : "7.0.0"
  },
  "tagline" : "The OpenSearch Project: https://opensearch.org/"
}
Run the following command to check if the cluster is working correctly:
curl -k -u admin https://<WAZUH_INDEXER_IP_ADDRESS>:9200/_cat/nodes?vYou should get an output similar to this:
ip              heap.percent ram.percent cpu load_1m load_5m load_15m node.role node.roles                               cluster_manager name
10.0.0.10           19          94   4    0.22    0.21     0.20 dimr      data,ingest,master,remote_cluster_client *               node-1
Installing Wazuh Server
Run the Wazuh installation assistant with the option --wazuh-server followed by the node name.
Note: The node name must be the same one used in config.yml for the initial configuration.
./wazuh-install.sh --wazuh-server wazuh-1Installing Wazuh Dashboard
Run the Wazuh installation assistant with the option --wazuh-dashboard followed by the node name.
Note: The node name must be the same one used in config.yml for the initial configuration.
./wazuh-install.sh --wazuh-dashboard dashboardPost-installation
Note: It's best that you find all passwords that the Wazuh installation assistant generated in the wazuh-passwords.txt file inside the wazuh-install-files.tar archive and keep it somewhere safe.
Run the following command to print all the passwords and save it somewhere safe.
tar -O -xvf wazuh-install-files.tar wazuh-install-files/wazuh-passwords.txtCheck all the core components are active. Run the following commands:
systemctl status wazuh-indexer
systemctl status wazuh-manager
systemctl status wazuh-dashboard
It's recommended in the documentation to disable Wazuh package repositories after installing all components on the server to prevent accidental upgrades.
sed -i "s/^deb /#deb /" /etc/apt/sources.list.d/wazuh.list
apt update
Test your installation
Open the dashboard URL in your browser. You should see the following screen.
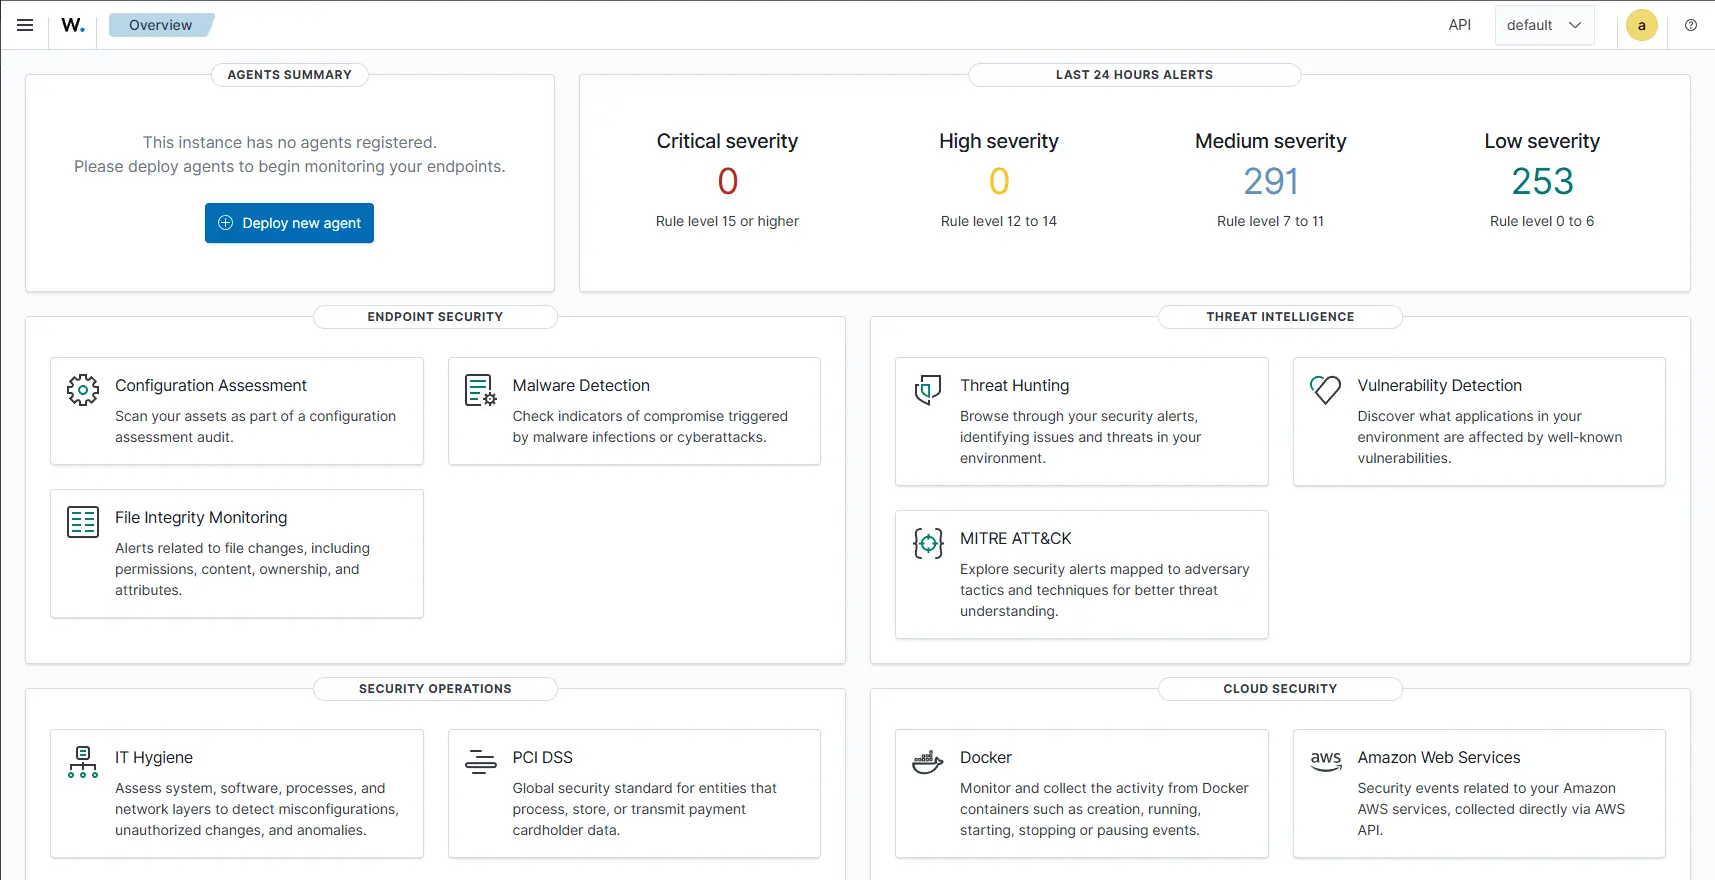
Install agent on a endpoint
Now we have our Wazuh running, we need to install Wazuh agent on the endpoints we wish to monitor. Go to one of your endpoint and start by adding the wazuh repository:
apt-get install gnupg apt-transport-https -y
curl -s https://packages.wazuh.com/key/GPG-KEY-WAZUH | gpg --no-default-keyring --keyring gnupg-ring:/usr/share/keyrings/wazuh.gpg --import && chmod 644 /usr/share/keyrings/wazuh.gpg
echo "deb [signed-by=/usr/share/keyrings/wazuh.gpg] https://packages.wazuh.com/4.x/apt/ stable main" | tee -a /etc/apt/sources.list.d/wazuh.list
apt update
Then, we will install the agent:
WAZUH_MANAGER="<wazuh server IP>" apt-get install wazuh-agentThen, we will need to enable the start the Wazuh agent service on the endpoint:
systemctl daemon-reload
systemctl enable wazuh-agent
systemctl start wazuh-agent
Note: You can think of deploying the agent using tools like Ansible for mass deployments.
Compatibility between Wazuh agent and the Wazuh manager is guaranteed when the Wazuh manager version is later than or equal to that of the Wazuh agent. Therefore, it's recommended to dsiable the Wazuh repository to prevent accidental upgrades. Run the following command to disable the repository:
sed -i "s/^deb/#deb/" /etc/apt/sources.list.d/wazuh.list
apt-get update
Verifying agent installation
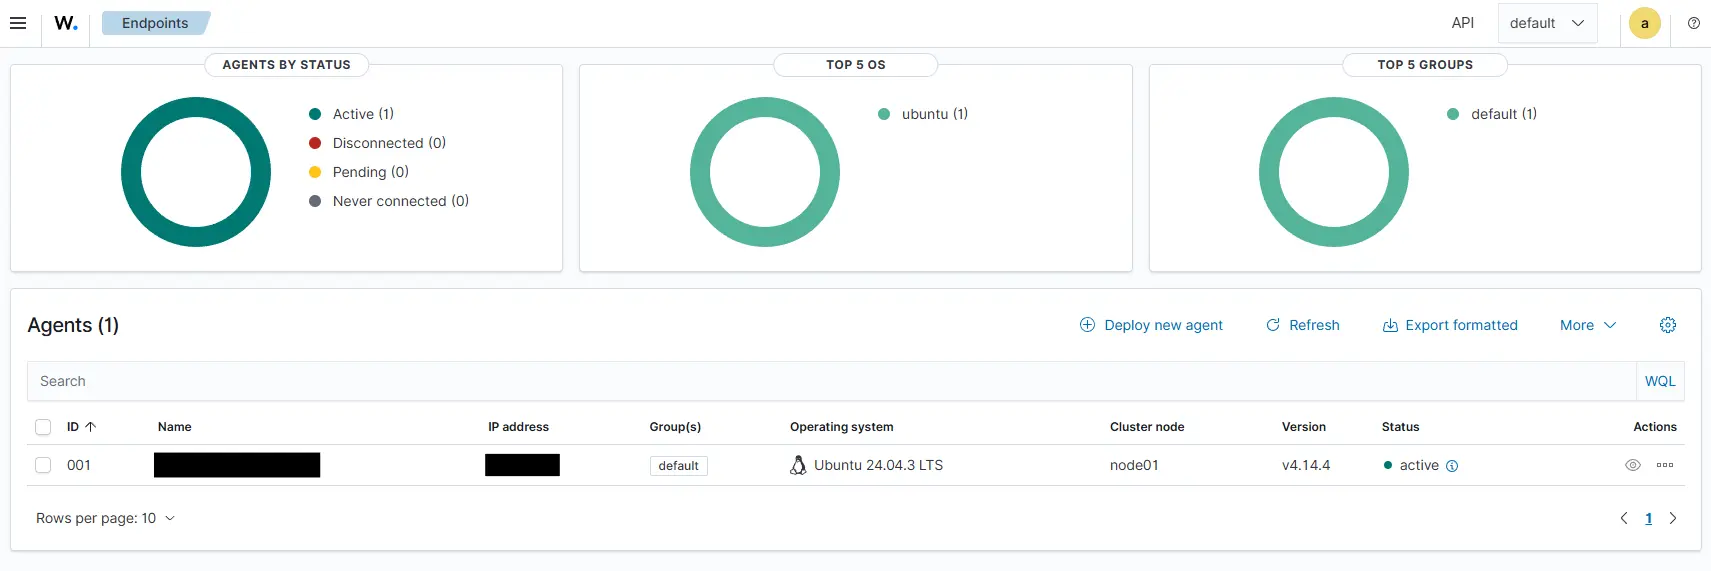
Go back to your Wazuh dashboard
https://<wazuh dashboard ip/url>/app/endpoints-summary#/agents-preview/You should see your agent showing as connected!
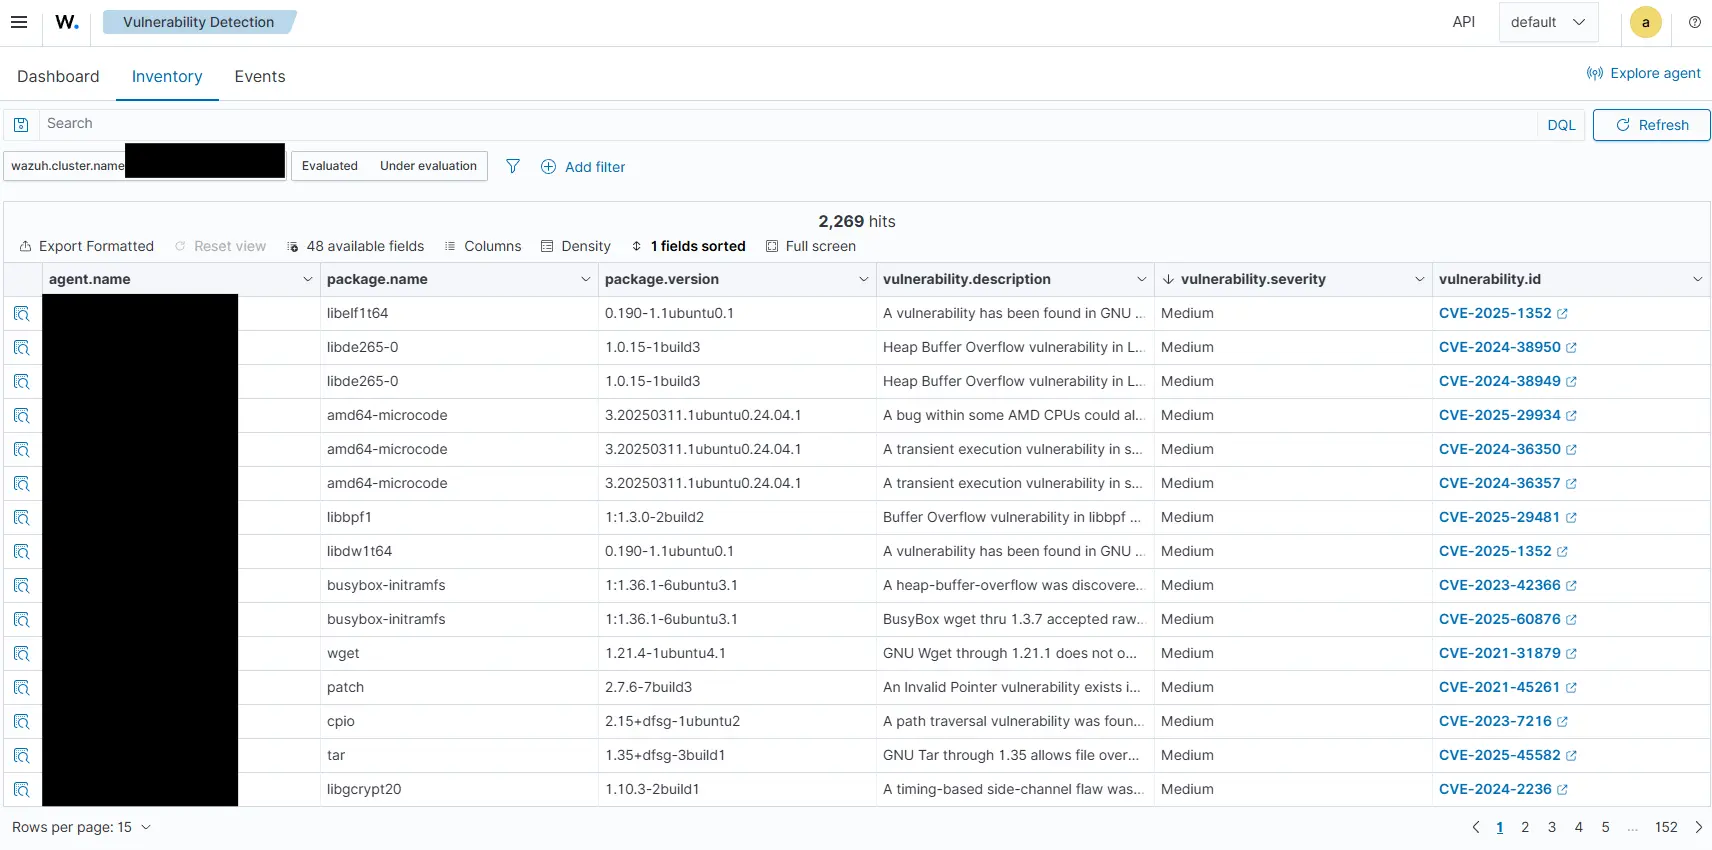
Navigating around, we can see the vulnerabilities reported by the agent.
Detecting Real Attacks (Hands-On Use Cases)
Setting up a SIEM is only the first step. The real value comes from what you can detect.
Detecting brute-force attacks (SSH)
One of the most common attack vectors is brute force authentication attempts.
In a Linux environment, this typically targets SSH:
- Multiple failed login attempts
- Rapid retries from same or different IP addresses
- Attempts across different usernames
With Wazuh:
- Authentication logs are continuously monitored
- Repeated failures trigger pre-defined detection rules
- Alerts are generated once thresholds are exceeded
I spinned up my WSL2 Ubuntu environment and attempt a simple SSH login attempt with the root username and random passwords:
alex@Alex-PC:~$ ssh [email protected]
The authenticity of host '10.0.0.81 (10.0.0.81)' can't be established.
ED25519 key fingerprint is SHA256:XZpGH5h3Escg8Qama+QPkCGSF1cWwCk45bvGX+GtyT5.
This key is not known by any other names.
Are you sure you want to continue connecting (yes/no/[fingerprint])? yes
Warning: Permanently added '10.0.0.81' (ED25519) to the list of known hosts.
[email protected]'s password:
Permission denied, please try again.
[email protected]'s password:
Permission denied, please try again.
[email protected]'s password:
[email protected]: Permission denied (publickey,password).
alex@Alex-PC:~$ ssh [email protected]
[email protected]'s password:
Permission denied, please try again.
[email protected]'s password:
Permission denied, please try again.
[email protected]'s password:
[email protected]: Permission denied (publickey,password).
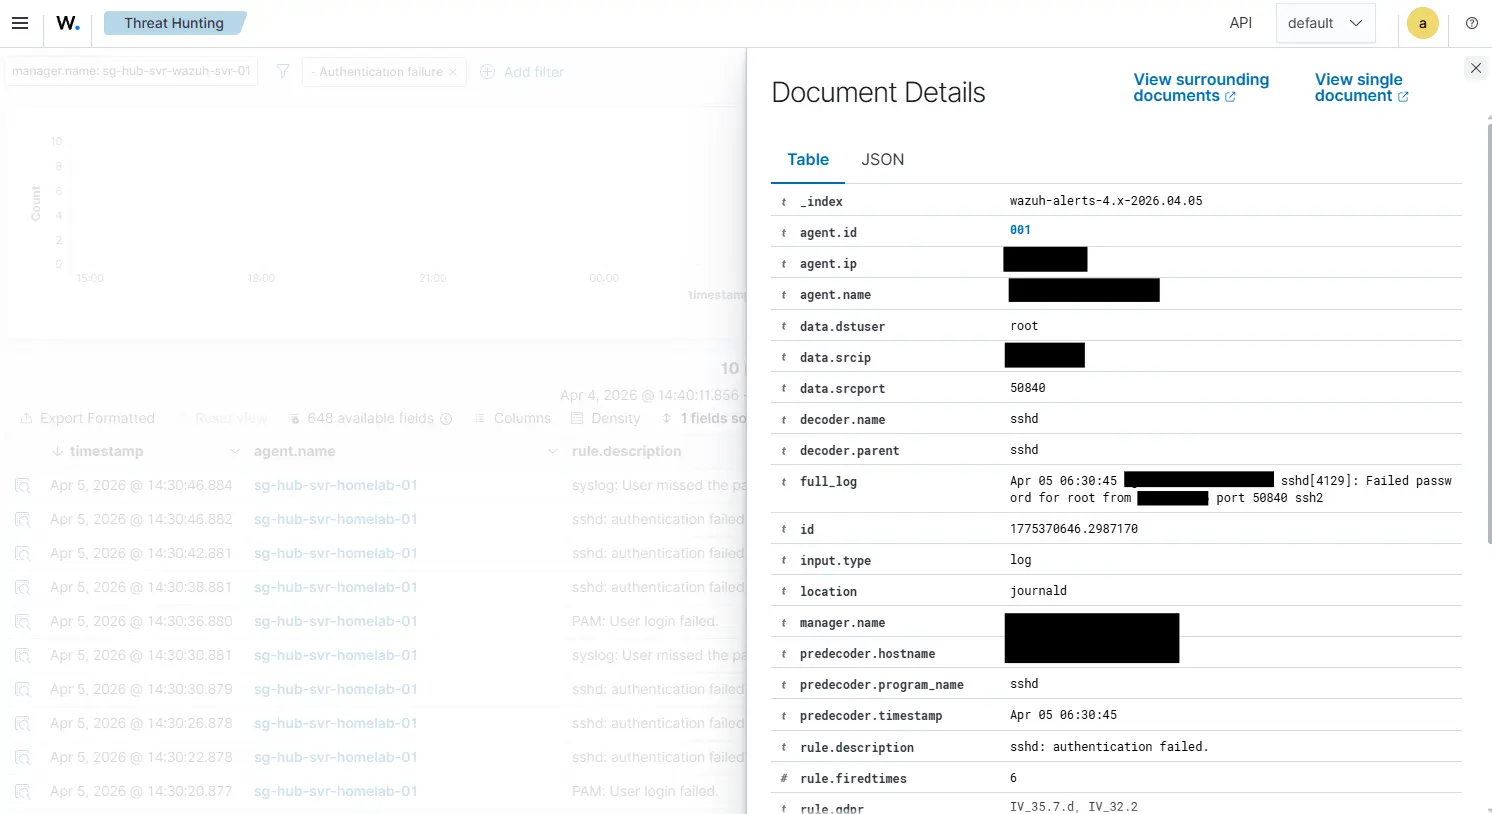
alex@Alex-PC:~$Heading back to my Wazuh Dashboard under Threat Hunting, I see the authentication failures being flagged.
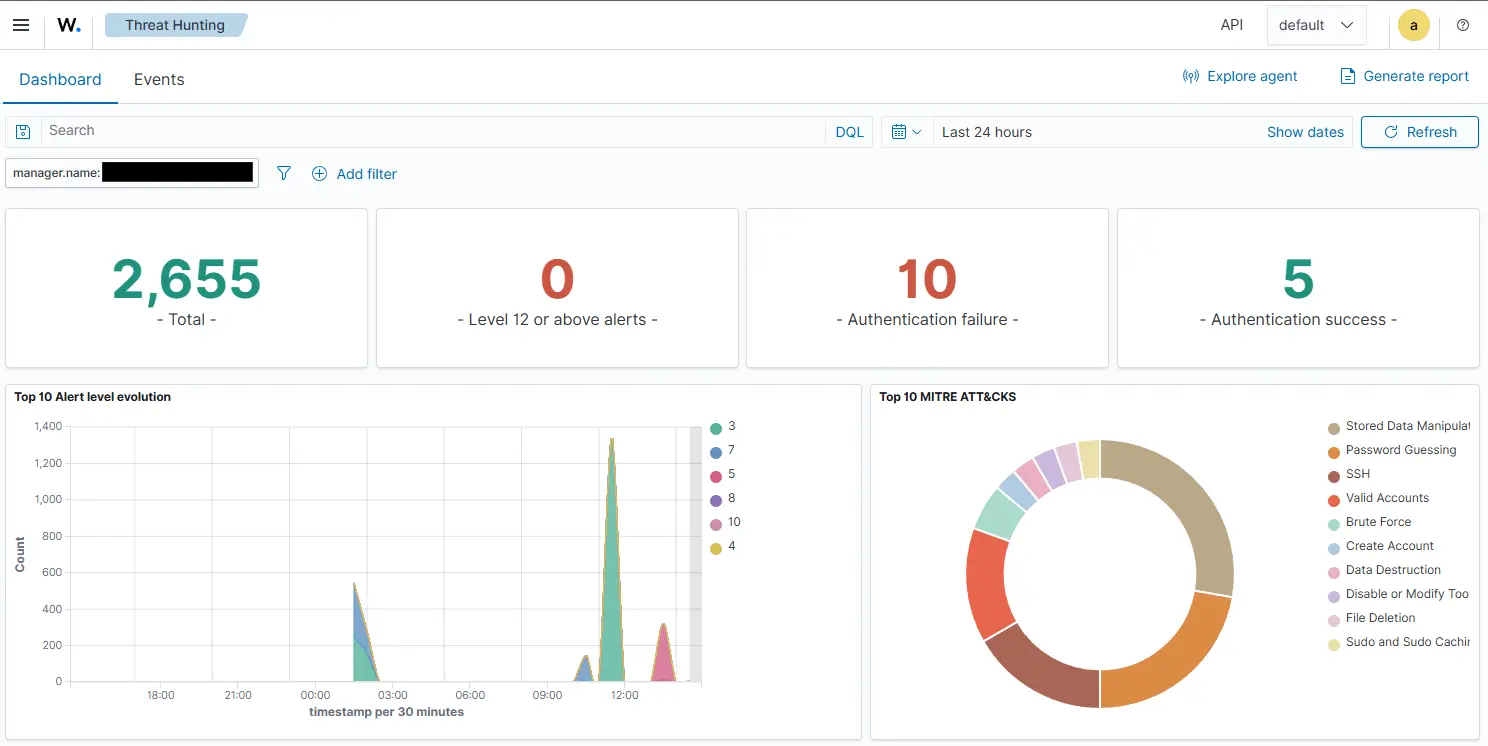
Heading into events, I can see the timestamps of all the failed attempts.
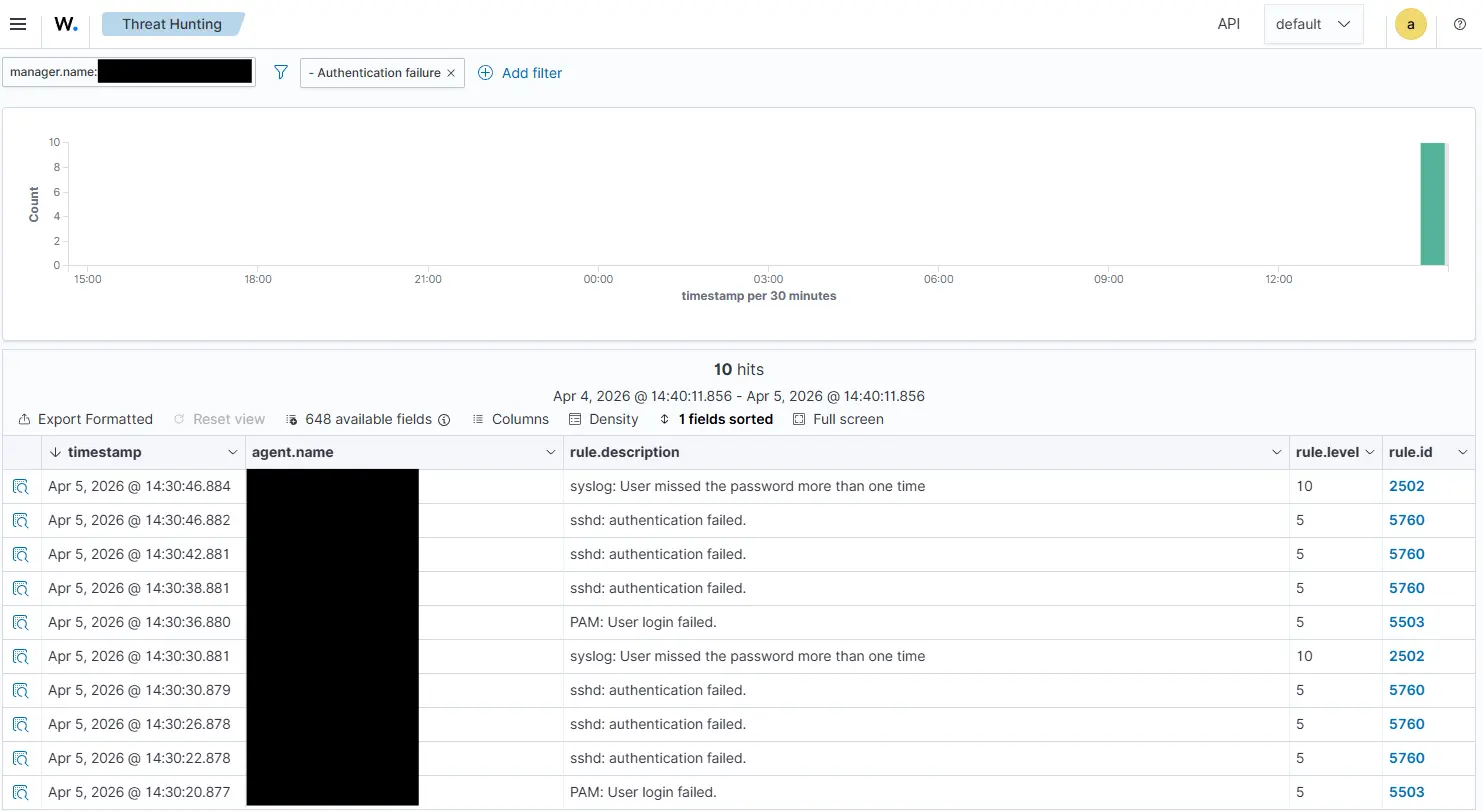
Clicking the magnifying glass icon on the left, I can see details about the event that includes the source IP where the authentication attempt originates from, etc.
Conclusion
Building a SIEM is more than just deploying another tool in your stack. What started as a homelab for experimentation can evolve into a controlled security playground.
By implementing Wazuh, you've effectively introduced the core capabilities of a Security Operations Center (SOC) into your own home environment. This shift from deployment to detection is what separates infrastructure engineers from security oriented engineers. This is in-line with the shift-left mentality in today landscape.